Website Insights: Issues – Analyzer
The Website Insights section of DQM shows data for one website scan. It is the place you can see the total issues, pages and misspellings for that website, the progress being made overtime, as well as diving deeper into specific issues to see where they occur on a page.
If you have website-level access only, you will see a navigation bar on the left similar to the images in this section of the guide. If you are an Admin, or if you have permissions set to “See the Group Performance Dashboard”, your navigation will also contain links to Group Performance.

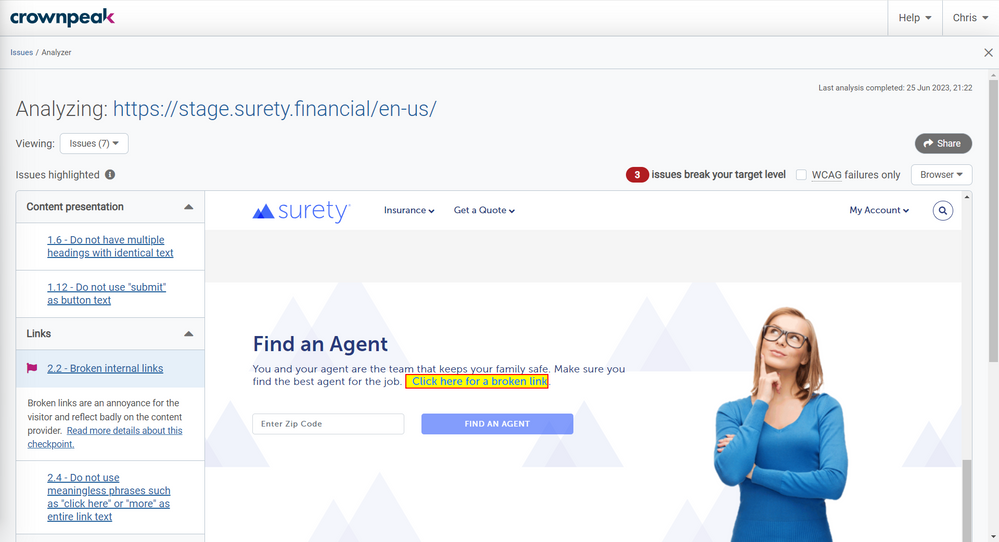
The Analyzer page provides all of the detailed Issues and Spelling data about an individual webpage, including highlighting where on the page an issue or misspelling occurs. You can also view File Details for this page.
The URL shown in the top-left is the page being analyzed here. Below that, you can use the Viewing drop-down box to switch between viewing Issues for this page, or Spelling mistakes for this page. The number in brackets shows you the number of checkpoints that report an issue for this page, and the number of misspellings found on this page, respectively.
In the very top-right of the page, you will see the “Last analysis completed” timestamp. This is the date and time that this particular page completed its checks against all the checkpoints.
When viewing Issues:
On the left-hand side there is a list of all the checkpoints that report an issue with this page. They are organized into the same categories as seen in the “Website Insights: Issues” page, and any priority checkpoints are marked in the same way with a red flag.
You can view issues for one checkpoint at a time, and the checkpoint that is highlighted in blue is the one you are currently viewing issues for. The highlighted checkpoint also shows its description, along with a link to “Read more details about this checkpoint.”
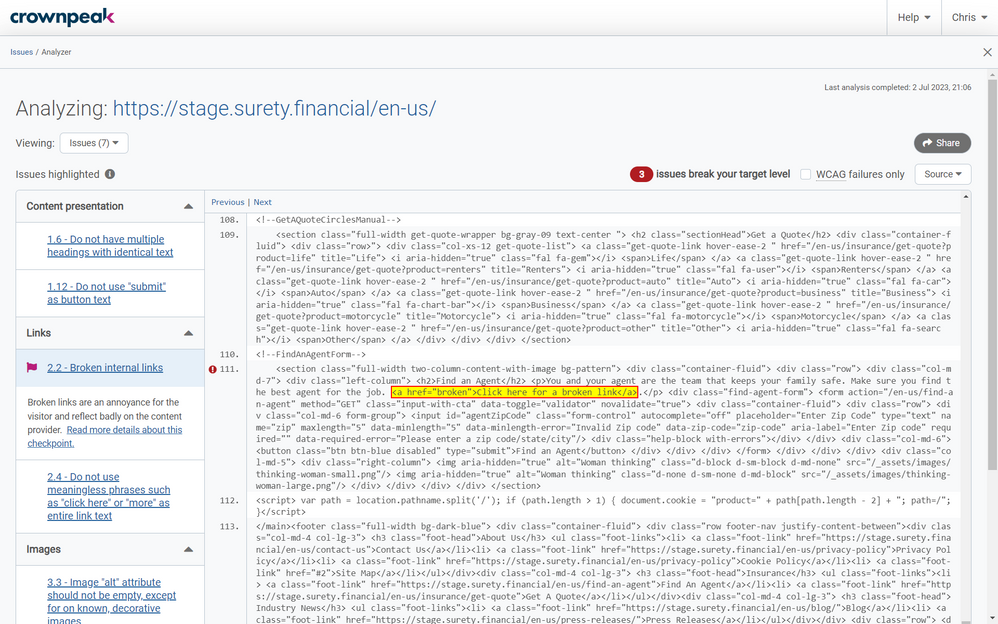
To the right of this, you will see the page itself. Using the drop-down menu in the top-right, you can toggle between the Browser and Source views.
When the Browser view is selected, a preview of the webpage is shown, and if possible, the issue will be highlighted in yellow on the page.

When the Source view is selected, the preview will show the source code of the page and should jump straight to an issue that is highlighted in yellow. If there is more than one instance of an issue for a checkpoint, you can use the Previous and Next buttons found in the top-left of the preview to cycle through these.

Some checkpoints will not be able to highlight anything visually as they are reporting that something is missing from the page (For example, “All pages should contain a link to a cookies policy” will not have anything to highlight because it is reporting that the cookies policy link is missing). In these cases, a message is displayed to explain this, in place of the webpage preview.
Above the webpage preview area, if any WCAG (Web Content Accessibility Guidelines) related checkpoints report issues for this page, the number of these checkpoints will be shown in red, along with the message “issues break your target level.” You can also select the checkbox next to this to view “WCAG failures only.” Selecting this will update the Analyzer to only show WCAG checkpoints to select in the left column.

After selecting any checkpoint in the left column, you can choose to share the issue using the Share button in the top-right (above the Browser/Source drop-down). For example, you may want to make a colleague aware of a new issue introduced to a page they are currently working on. When you click on this Share button, a pop-up window is displayed showing you details about what you want to share. You can choose to add any comments into the text box if you wish, and then click “Next.” This will then produce an output that you can add to wherever you would like to share this (For example, in an email, Slack message, or in JIRA). When you are done, click “Finish” to close the pop-up window.
NOTE: Any user you share the issue with will need to have access to DQM in order to see the Analyzer page you are sharing with them.
When viewing Spelling:

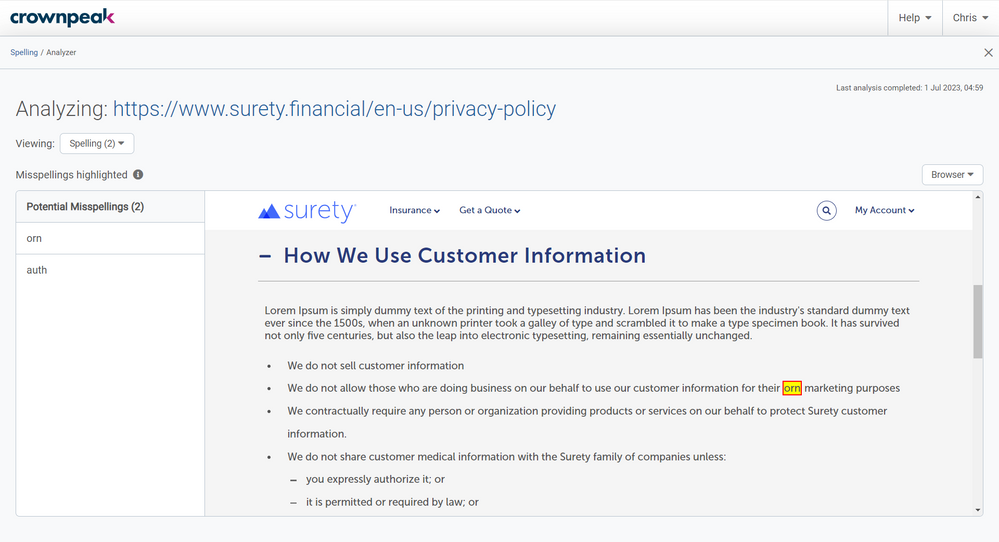
All the potential misspellings found on the page are listed in the left column. We use the phrase “Potential Misspellings” because there may be words that, although not in the dictionary, are approved words in your organization (for example, brands). In these cases, it is possible to add words to your custom dictionary (see Website Insights: Spelling), but your user account needs to have the permissions set to perform this action.
To the right of this, you will see the page itself. Using the drop-down menu in the top-right, you can toggle between the Browser and Source views.
When the Browser view is selected, a preview of the webpage is shown, and misspelled words will be highlighted in yellow on the page.
When the Source view is selected, the preview will show the source code of the page and should jump straight to a misspelled word that is highlighted in yellow. If there is more than one misspelled word on the page, you can use the Previous and Next buttons found in the top-left of the preview to cycle through these.
When viewing File Details:

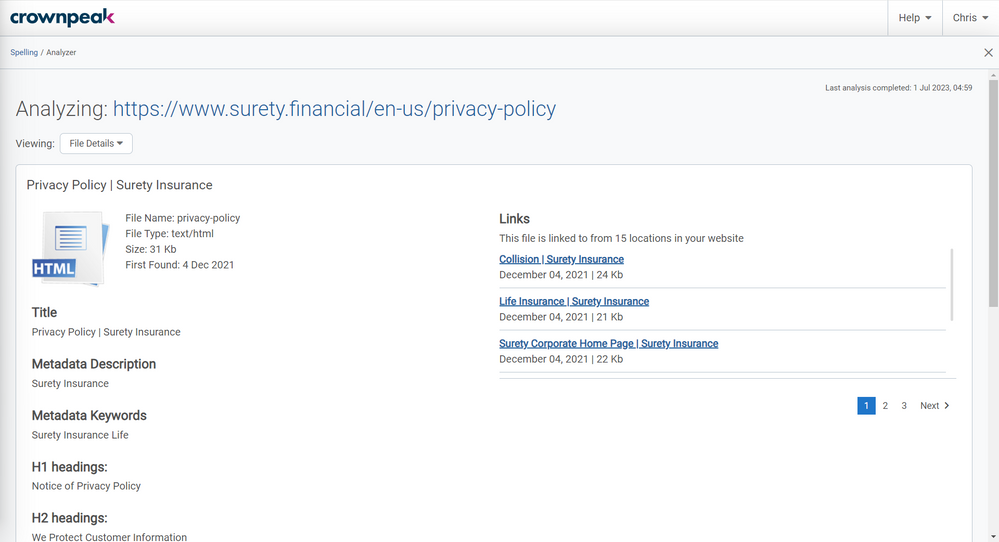
The Analyzer shows information about this page. All other web files found in the Inventory (e.g. PDFs, CSS files etc. - See Website Insights: Inventory) can also be opened in the Analyzer, and these will also have a “File Details” section to see information about them.
For web pages, the information includes the file name, the file type, the size of the file, and the date we first scanned the file in this Website Dashboard. Other metadata may also be shown, if available, such as Title, Description, Keywords and Headers. If the file asset is linked from other web pages, a list of these will be show on the right side of the Analyzer.
Tips
- Sometimes issues may be in menus or elements that only appear when you click on them so it may not always be clear where the issue is in Browser view. Try clicking on menu or expandable items, or switch to the Source view to help identify where the issue might be.