Group Performance: Category Compliance
The Group Performance section of DQM shows the combined data for all of the websites in a Group. A Group is a collection of websites and every DQM instance has at least the “All Websites” Group. It is possible for Admins to create and manage groups to contain any number of the websites set up in the DQM instance. Details on how to do this can be found in the “Admin Tools - Group Management” section.
If you have website-level access only, you will not have access to this section. Only Admins, or users with permissions set to “See the Group Performance Dashboard” can access the Group Performance pages. If you need access to these pages, you should speak to an Admin of your account.

Category Compliance shows if each website in the group you are viewing passes or fails a category of checkpoints. You can change the group you are viewing using the dropdown in the top-right.
Your checkpoints are grouped into Categories, as also shown in the Issues page of a single website (See “Website Insights: Issues”). By default, these categories are "Brand", "Content presentation", "Links", "Images", "Rich media", "Title & metadata", "Template", "URL structure & code", "Cookies" and "Mobile", but your setup may differ as it is possible to have custom Categories. Categories are simply ways of grouping together checkpoints that are similar in what they are reporting issues about.
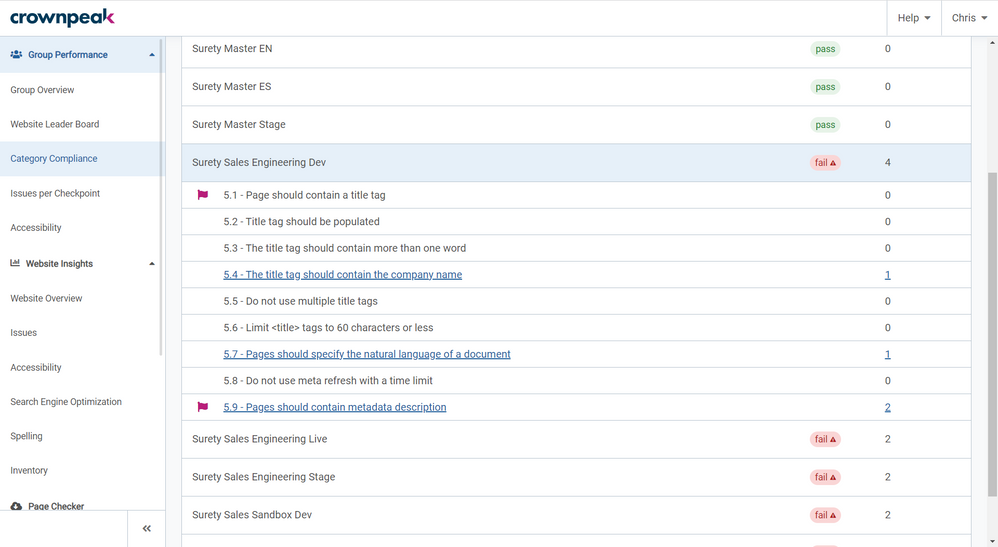
The Category Compliance page will show the compliance for one Category at a time. You can choose the category to analyze using the Checkpoint Category drop-down menu. Once a category is selected, a list of all of the websites in this group will show, along with a pass/fail Status, and an Issue count. The status of a website will show as a fail if there are any issues reporting for any of the checkpoints in this Category. The status of a website will show as a pass if there are 0 issues reporting for all of the checkpoints in this Category.

Clicking on a website will expand the table to show the specifics of exactly which checkpoints report issues for the website, if any. Red flags show for any checkpoints that have been set as Priority. The number of pages on the expanded website that report issues for the checkpoint is shown on the far right. Any checkpoints that report issues are clickable.

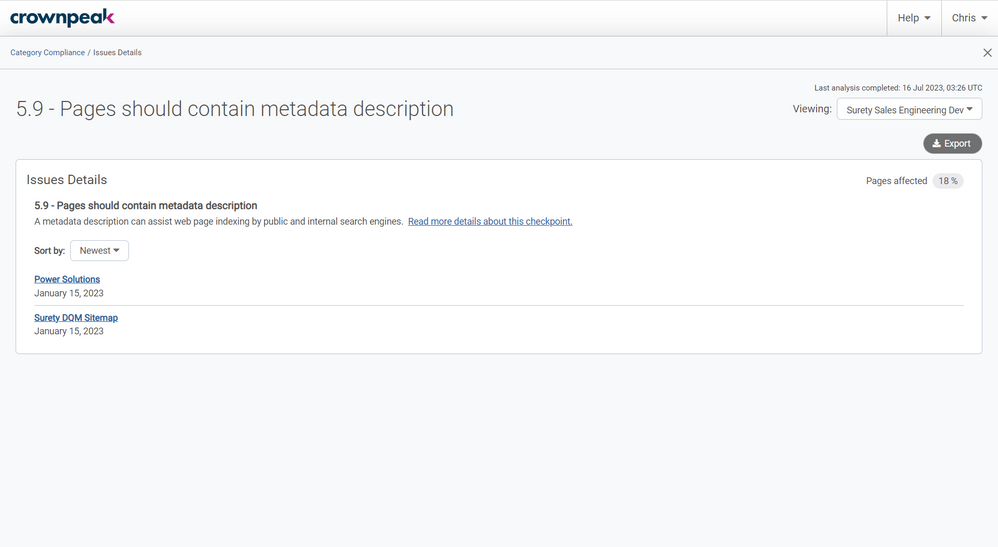
Clicking on a checkpoint that reports issues opens an overlay providing more details, including a short description of the checkpoint, and the list of pages that contain an issue for this checkpoint. This is similar to the “Website Insights: Issues” page.
The date shown under each page listed is the date that we first reported this page as an issue. This date will remain the same with each subsequent scan where the issue remains unresolved.
The percentage of pages on the website that report this issue is shown to the far right of the checkpoint name, along with a button to Export the list of issues for this checkpoint to a CSV.
From the list of pages shown that report an issue for this checkpoint, clicking on one will open the Analyzer as an overlay (See “Website Insights: Issues – Analyzer” for more details). To close the checkpoint overlay or the analyzer overlay, click the “X” in the top-right (just below your name).