Debugging Templates
Introduction
Developing templates is reasonably straight forward. Until you run into a problem of course. If you're using Visual Studio, the compiler will let you know about any compile time errors -- you get the same effect if you're editing template code in the CMS by saving the handler or by recompiling the template and/or library folder. The real challenge happens when there is a runtime error. The CMS does report these errors but there are a number of reasons that this is difficult to interpret or use, not least is that line numbers reported for any error are way out because of how the template engine reads in and compiles your handlers.
So, what are your options for debugging runtime errors? The process is made more challenging by the fact that all the code is running remotely on the CMS API servers and not on your local machine. This does limit your options to debug or trace logging statements.
Logging
This is the oldest way of finding out what is happening in any computer programme, and also the most primitive. You have three options for logging when debugging DXM template code:
- Out.WriteLine;
- Out.DebugWriteLine; and
- Util.Log
Out.WriteLine
Out.WriteLine is the simplest to use but can only be used effectively in output templates (output.aspx and related handlers). Out.WriteLine is the mechanism your template code uses to output your actual template output so there will be a mixture of the two -- which means that this form of debugging must be temporary as you wouldn't want the debug output visible in your production output. The debug information can be visual, if you're using the in-CMS preview or publishing the asset and viewing the result from a published location.
However, what is often better is to put your debug output into comments in whatever format you're outputting. This prevents debug code from a) being visible; and b) interfering with any layout or presentation. This also means that you could consider leaving some debug information in your production code. One such statement I highly recommend is outputting the asset id (and any other useful information) in your output as this makes it much, much easier to locate the asset responsible for a particular published page or component.
For example:
Out.WriteLine(
  "<!-- asset-id: {0}; template-id={1}; published={2} -->",
  asset.Id,
  asset.TemplateId,
  DateTime.UtcNow);
Out.DebugWriteLine
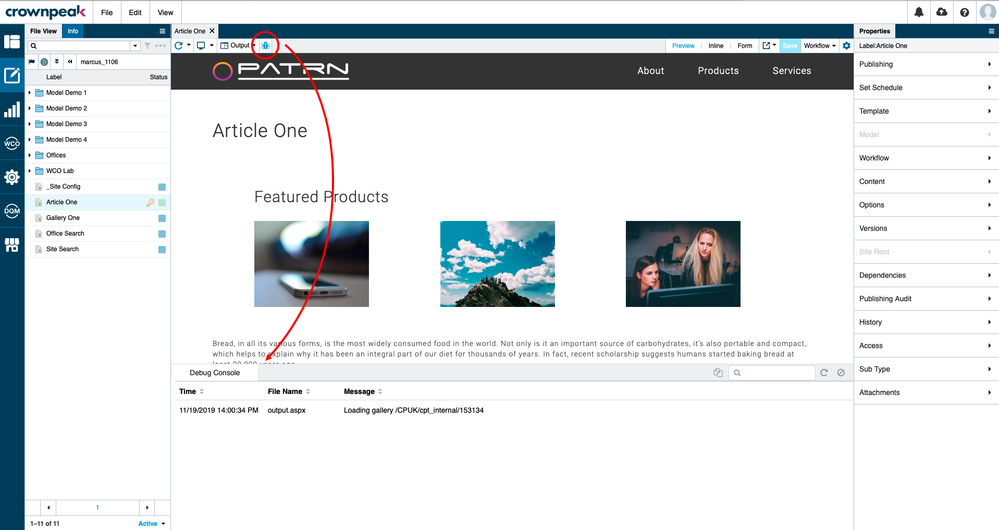
Out.DebugWriteLine is the next method. This method is different in that although it is using the the Out class, it does not write to the output context. Instead, this method will write to the debug console.
The debug console can be made visible by clicking the toolbar button above the content view or form view (see screenshot below).
Using Out.DebugWriteLine is simple as it works exactly the same way as Out.WriteLine does, which means you can just replace one with the other in your template code. The only difference is that you no longer need to enclose the log data in a comment of some kind.
Out.DebugWriteLine(
  "asset-id: {0}; template-id={1}; published={2}",
  asset.Id,
  asset.TemplateId,
  DateTime.UtcNow);
The debug console can be a little tricky because it doesn't always show your log statements. If you find that this happens, click on the "Refresh" button in the debug console to have the output run again.
Out.DebugWriteLine is a better choice than Out.WriteLine because:
- you can leave the debug log statements in the code without any concerns about the data being present in your output
- you can use Out.DebugWriteLine in any template handler, including ones that aren't output related like filename.aspx
- you can extract all your log data
Util.Log
The final log-based debug method is Util.Log. The method itself is straighforward to understand although I would recommend always using the override where you specify the "current" asset as the first parameter. This will makea finding your log data later much easier.
Util.Log(
  asset,
  "template-id={0}; published={1}",
  asset.TemplateId,
  DateTime.UtcNow);
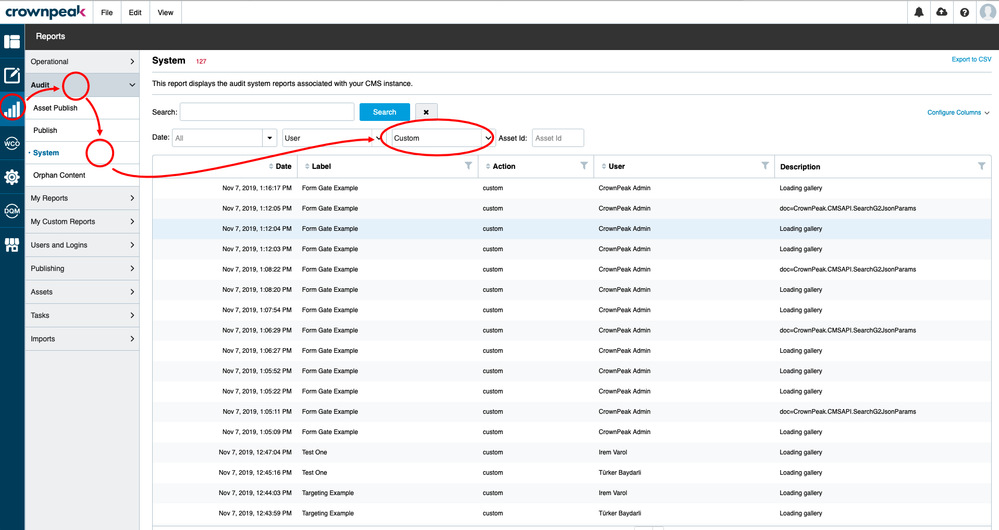
To view your log statements, you will need to:
- Access the system audit report;
- Click "Advanced"; and
- Select "Custom" from the audit type.
- You can limit the log statements to the asset you're interested in by the asset id as a filter criteria.

The advantages of Util.Log are that:
- it is available everywhere and has no dependency on being in output-producing code or triggered by output producing actions like workflow;
- it is durable -- the log data cannot be lost
Having said that, this method should only be used as a method of last resort. This is precisely because Util.Log writes your log data to the CMS system audit log, which is a) permanent; and therefore b) costly in terms of data storage. If you need to use Util.Log, please remove or comment out these log statements in your code.
Other techniques
Some template handlers aren't a good fit for the output triggered logging and cannot be debugged using Visual Studio. In cases like this where you have problems there are two approaches that have proved useful:
- Copy the code into an output handler and test it there. This won't always be possible, especially if you use the handler-specific context object for anything.
- Collect your log data and write it to an asset. This mechanism is very useful for code that runs in the background like post_save_job.aspx. In this scenario, you could collect your log data together by using a C# StringBuilder instance and judicious use of StringBuilder.Append, StringBuilder.AppendFormat and StringBuilder.AppendLine. Once you have your log data collected, you can write this back to the asset that is in the context using Asset.SaveContentField; or create a separate log/job/run asset using Asset.CreateNewAsset.
Conclusion
We have looked at a number of options available to you for debugging. The method you choose will be situation-dependant but I expect most people will start with Out.WriteLine as it is the most similar to the old "log to the console" idea. Having said that, I would encourage you to switch to Out.DebugWriteLine so that your logging can remain in the code and be useful to the next developer to look at the code.

