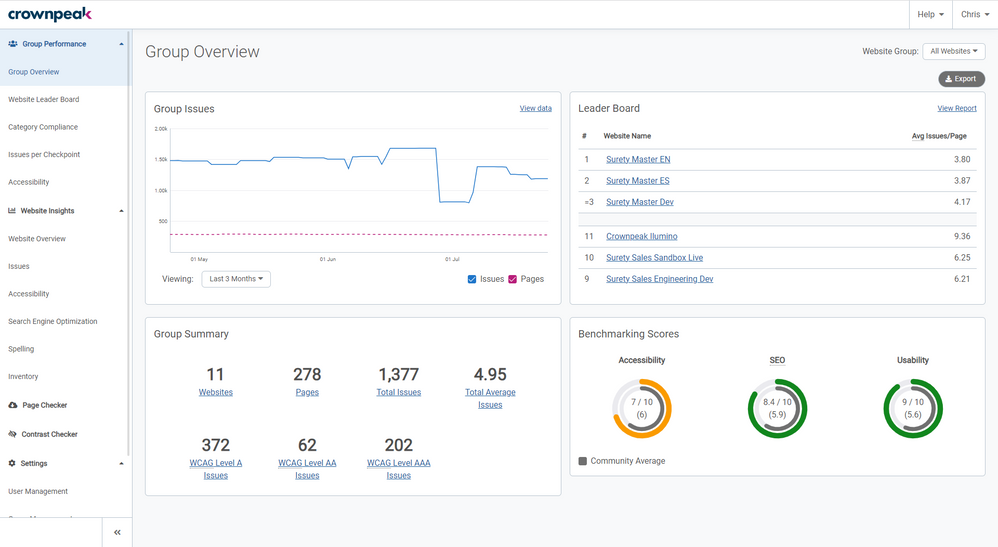
The Group Performance section of DQM shows the combined data for all of the websites in a Group. A Group is a collection of websites and every DQM instance has at least the “All Websites” Group. It is possible for Admins to create and manage groups to contain any number of the websites set up in the DQM instance. Details on how to do this can be found in the “Admin Tools - Group Management” section.
If you have website-level access only, you will not have access to this section. Only Admins, or users with permissions set to “See the Group Performance Dashboard” can access the Group Performance pages. If you need access to these pages, you should speak to an Admin of your account.
 Group Overview page in Crownpeak DQM
Group Overview is the landing page for Admins and shows top-level figures for the group you are viewing. Every DQM instance has at least the “All Websites” Group, and if you have other groups set up, you can change the group you are viewing using the dropdown in the top-right.
The Group Issues graph on the left of the page shows the progress of the group based on the combined number of pages and combined number of issues reported by all of the websites in this group overtime. You can adjust the timeframe the graph displays by changing the “Viewing” option selected, and you can also check or uncheck “Issues” and “Pages” to choose whether or not to display those lines on the graph. You can toggle between showing the graph lines or a table of the exact data by clicking “View data” in the top-right of the graph itself.
The Group Summary box in the bottom-left shows the top-level statistics for this group, including the number of websites in the group, the total number of pages and the total number of issues of all of the websites combined. Clicking on the link below any of these numbers will take you to the relevant page in the Group Performance section for more information about that data.
The Leader Board in the top-right shows the top 3 and the bottom 3 websites in this group when ranked by the average number of issues per page each website has (See “Group Performance: Website Leader Board” for more information about this). You can click on any of these websites to take you to the Website Overview page for that website.
The Benchmarking Scores in the bottom-right show how your websites are performing against industry standards for the key compliance areas of On-page SEO, Accessibility and Usability. The scores shown are the average for all of the websites in the group you are currently viewing and are represented by the outer circles in the graph. The Community average scores are shown by the inner circle in grey and can be toggled to show or hide by the “Community Average” checkbox. For more information about Benchmarking, see “Benchmarking Scores”.
You can Export data from this group in the form of CSVs. The button for this is in the top-right. The downloads are as follows:
- Group Overview (CSV): High-level figures for the websites in this group, including Total Issues, Pages, Average Issues per Page, and Benchmarking Scores.
- Group Issue Summary (CSV): The Issue Count for each Checkpoint, and for each Website in the group (0 counts are not included).
- Group Inventory Summary (CSV): The File Asset counts for each website in the group.
