Hi -
Yes, the debug tool is available in V3.
First step, make sure you have it enabled in your preferences.
This is available from the Settings > Account > Edit Preferences.
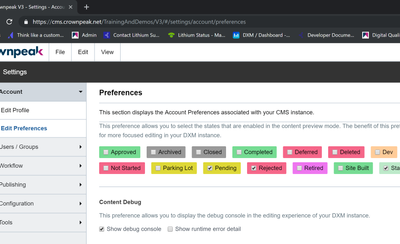
![Crownpeak V3 - Settings - Account - Google Chrome 8_6_2019 4_02_48 PM.png Crownpeak V3 - Settings - Account - Google Chrome 8_6_2019 4_02_48 PM.png](https://community.crownpeak.com/t5/image/serverpage/image-id/542i890538C4A00DB737/image-size/medium?v=v2&px=400)
When you have Show Debug Console selected, you will see the bug icon when you switch back to content mode.
Select it and see the Debug Console at the bottom of the workspace.
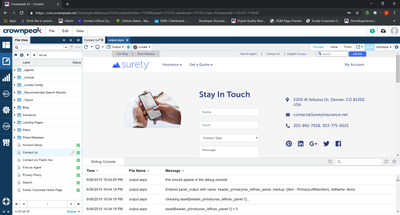
![Crownpeak V3 - Settings - Account - Google Chrome 8_6_2019 4_04_44 PM.png Crownpeak V3 - Settings - Account - Google Chrome 8_6_2019 4_04_44 PM.png](https://community.crownpeak.com/t5/image/serverpage/image-id/541i390DF6E51504FE55/image-size/medium?v=v2&px=400)
In your templates, use Out. DebugWriteLine to output to the console
Best,
Denise