Search Blog
- Crownpeak Community
- :
- Resources
- :
- Blog
- :
- Creating a Google Analytics Dashboard - Crownpeak ...
Creating a Google Analytics Dashboard - Crownpeak DXM
- Subscribe to RSS Feed
- Mark as New
- Mark as Read
- Bookmark
- Subscribe
- Printer Friendly Page
- Report Inappropriate Content
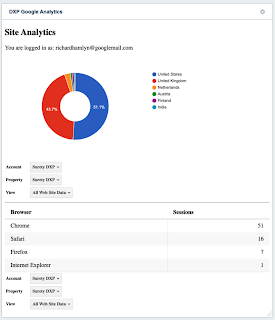
In this blog, you will see how you can easily create a Google Analytics Dashboard in Crownpeak DXM. The outcome will produce a Dashboard in Crownpeak DXM that looks like this:
 |
| Crownpeak DXM Dashboard Screenshot |
Step 1: Google Analytics (GA)
Make sure you have a GA account that is set up to receive data from your site.
https://analytics.google.com
Log in to your Google Cloud Console at https://console.cloud.google.com and select APIs & Services from the menu.
Select Credentials from the menu and create a new OAuth 2.0 Client ID.
Set up your Client ID as follows:
- Name: GA Dashboard.
- Authorised JavaScript origins: https://cms.crownpeak.net
Before you save, take a note of your Client ID.
Save the new Client.
Step 2: Create a Crownpeak DXM Template and Asset
In your Crownpeak DXM instance, navigate to your templates folder
Create a new Template and name it Google Analytics.
In the output.aspx template, add the following:
Note! Don't forget to change <your_client_id> with your own Client ID created in Step 1.
<%@ Page Language="C#" Inherits="CrownPeak.Internal.Debug.OutputInit" %>

<%@ Import Namespace="CrownPeak.CMSAPI" %>
<%@ Import Namespace="CrownPeak.CMSAPI.Services" %>
<!--DO NOT MODIFY CODE ABOVE THIS LINE-->
<% //MODIFY or ADD Import Statements to Define Namespaces Used by the Template %>
<%//This plugin uses OutputContext as its context class type%>
<%
   // output.aspx: template file to specify the published content in site HTML
   // if no preview.aspx exists, then this is used by default for preview
 %>
<!-- Scripts taking from my Google Analytics as provided by Segment -->
<script async src="https://www.google-analytics.com/analytics.js"></script>
<script>
(function(w,d,s,g,js,fs){
  g=w.gapi||(w.gapi={});g.analytics={q:[],ready:function(f){this.q.push(f);}};
  js=d.createElement(s);fs=d.getElementsByTagName(s)[0];
  js.src='https://apis.google.com/js/platform.js';
  fs.parentNode.insertBefore(js,fs);js.onload=function(){g.load('analytics');};
}(window,document,'script'));
</script>
<h2>
  Site Analytics
</h2>
<div id="embed-api-auth-container"></div>

<div id="session-chart-container"></div>
<div id="view-selector-session-container"></div>
<hr>
<div id="browser-chart-container"></div>
<div id="view-selector-browser-container"></div>
<script>

gapi.analytics.ready(function() {

  /**
   * Authorize the user immediately if the user has already granted access.
   * If no access has been created, render an authorize button inside the
   * element with the ID "embed-api-auth-container".
   */
  gapi.analytics.auth.authorize({
    container: 'embed-api-auth-container',
    clientid: '<your_client_id>.apps.googleusercontent.com'
  });

  /**
   * Create a ViewSelector for the first view to be rendered inside of an
   * element with the id "view-selector-1-container".
   */
  var viewSelector1 = new gapi.analytics.ViewSelector({
    container: 'view-selector-session-container'
  });

  /**
   * Create a ViewSelector for the browser.
   */
  var viewSelector2 = new gapi.analytics.ViewSelector({
    container: 'view-selector-browser-container'
  });

  // Render both view selectors to the page.
  viewSelector1.execute();
  viewSelector2.execute();

  /**
   * Create the first DataChart for top countries over the past 30 days.
   * It will be rendered inside an element with the id "session-chart-container".
   */
  var dataChart1 = new gapi.analytics.googleCharts.DataChart({
    query: {
      metrics: 'ga:sessions',
      dimensions: 'ga:country',
      'start-date': '30daysAgo',
      'end-date': 'yesterday',
      'max-results': 6,
      sort: '-ga:sessions'
    },
    chart: {
      container: 'session-chart-container',
      type: 'PIE',
      options: {
        width: '100%',
        pieHole: 4/9
      }
    }
  });

  /**
   * Create the second DataChart for browser usage.
   * It will be rendered inside an element with the id "browser-chart-container".
   */
  var dataChart2 = new gapi.analytics.googleCharts.DataChart({
    query: {
      'dimensions': 'ga:browser',
      'metrics': 'ga:sessions',
      'sort': '-ga:sessions',
      'max-results': '6'
    },
    chart: {
      type: 'TABLE',
      container: 'browser-chart-container',
      options: {
        width: '100%'
      }
    }
  });

  /**
   * Update the first dataChart when the first view selecter is changed.
   */
  viewSelector1.on('change', function(ids) {
    dataChart1.set({query: {ids: ids}}).execute();
  });

  /**
   * Update the second dataChart when the second view selecter is changed.
   */
  viewSelector2.on('change', function(ids) {
    dataChart2.set({query: {ids: ids}}).execute();
  });
});
</script>
Save your template.
Navigate to a suitable location to store your Google Analytics asset that will represent your report. You could use the root of your site but wherever you decide to locate the asset, remember its location for later.
File -> New File
 |
| New GA Asset linked to your GA Template |
Click Create.
 |
| GA Asset in Preview |
 |
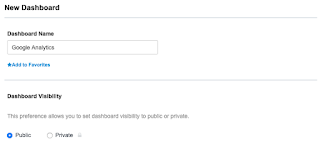
| Create a new Dashboard |
Select AP Asset Previewer from the options.
You must be a registered user to add a comment. If you've already registered, sign in. Otherwise, register and sign in.
-
Accessibility
1 -
Angular
1 -
CMS
7 -
Developer
1 -
DXM
8 -
ExactTarget
1 -
Facebook
1 -
Headless
3 -
Integrations
1 -
React
1 -
Salesforce Marketing Cloud
1 -
Scaffold
1 -
SDK
1 -
Search
1 -
SEO
1 -
Social
1 -
SPA
1 -
Vue
1 -
Vue.JS
1
- « Previous
- Next »

